Welcome, Developer 🖖 it’s been quite a long time since our last post, hasn’t it? Hope you have enjoyed the new design of our blog!
Today, I’m going to walk you through one of my favourite open-source data visualization libraries. Grab a coffee and join me, developer!
Table of contents
Open Table of contents
Introduction
The ApexCharts is an open-source library with modern and interactive charts.
It has a wide collection of charts available to choose from, they’re all responsive to different screen sizes, flexible and customizable, and pretty easy to use. How much does a license cost? Nothing, it’s free! (as the term “open-source” already suggests)
Currently, it is my go-to library when quickly presenting data in a React application 👌
Allow me to give you a little spoiler on what we’re doing during the exercise of today, developer. The proposed challenge is to fetch data from an API and present it in a chart.
The data source we will use is Binance. The API endpoint we will use to populate our chart is free (and does not require an API key 😅).
Then, to visualize our financial data, what about we use a pretty cool Candlestick chart?
Sound exciting? Let’s go 💪
Creating React App
First things first, shall we create a React application?
yarn create vite my-apexcharts-app --template react-tsMy tech stack choices are:
- Yarn for package management (npm instead? Sure thing!)
- Vite for frontend tooling (CRA instead? Sure thing!)
- TypeScript as a typed language (Vanilla JavaScript instead? Sure thing!)
Just to check if the app is running:
cd my-apexcharts-app
yarn
yarn dev
All good? It has never been so easy and quick to create a React app, huh? Let’s move on, developer!
Installing ApexCharts
Next, let’s install the React ApexCharts library:
yarn add react-apexcharts apexchartsData Type
Before we start fetching data from the API, we must do a couple of quick steps:
- Under src, create a new folder called types:
mkdir src/types- Create a TypeScript file called index.ts:
touch src/types/index.ts # echo "" > src/types/index.ts (Windows)With the FinancialData interface to represent the data fetched from the API:
export interface FinancialData {
  [key: number]: string | number;
}
Curious about the response format of the API endpoint, huh? Allow me to explain it…
Data Source
Just run it on a web browser or API platform (eg, Postman):
GET https://data.binance.com/api/v3/uiKlines?symbol=ETHBTC&interval=1d&startTime=1672574400000There’re a few parameters in this URL:
- Symbol (ETHBTC)
- Interval (Daily)
- Start Time (January 1, 2023)
What did you get? An array of arrays? a bunch of key-value pairs? Well, that’s pretty much it. Below is the proper description:
[
  [
    1499040000000,      // Kline open time
    "0.01634790",       // Open price
    "0.80000000",       // High price
    "0.01575800",       // Low price
    "0.01577100",       // Close price
    "148976.11427815",  // Volume
    1499644799999,      // Kline close time
    "2434.19055334",    // Quote asset volume
    308,                // Number of trades
    "1756.87402397",    // Taker buy base asset volume
    "28.46694368",      // Taker buy quote asset volume
    "0"                 // Unused field. Ignore.
  ]
]
What are the fields that we will use in this exercise:
- Kline open time
- Open price
- High price
- Low price
- Close price
How they are mapped by the FinancialData interface we created? Each field will be mapped using a zero-based index, with a value that can be both a string or a number. Thus, the key-value pair in the format we created. Does that make sense? Don’t worry about it, I’ll illustrate it later on.
Fetching Data
- Under src, create a new folder called api:
mkdir src/api- Create a TypeScript file called client.ts:
touch src/api/client.ts # echo "" > src/api/client.ts (Windows)- Let’s write a function to fetch data from the API and return it as a JavaScript Promise:
import { FinancialData } from "../types";

const apiUrl =
  "https://data.binance.com/api/v3/uiKlines?symbol=ETHBTC&interval=1d&startTime=1672574400000";

export const getFinancialData = () =>
  fetch(apiUrl)
    .then((res) => res.json())
    .then((data: FinancialData[]) => data);
Good, shall we test it? We’ll delete the code below after testing, so do not worry about it! On the App.tsx component:
import { useEffect, useState } from "react";
import { getFinancialData } from "./api/client";
import { FinancialData } from "./types";

import "./App.css";

function App() {
  const [data, setData] = useState<FinancialData[]>();

  useEffect(() => {
    async function runEffect() {
      // fetch data from client
      const data = await getFinancialData();

      // set data to state
      setData(data);
    }

    // run the async function
    runEffect();
  }, []);

  return (
    <div style={{ display: "flex", justifyContent: "center" }}>
      {!data ? <p>Loading...</p> : <p>{data.length} records fetched.</p>}
    </div>
  );
}

export default App;
Does everything make sense so far, developer?
CSS Polishing
Just some quick CSS changes to make your app look like mine, if you wish so. On src, create or modify your App.css file:
#root {
  min-width: 100vw;
  margin: 0 auto;
  text-align: center;
}
On src, create or modify your index.css file:
:root {
  font-family: Inter, system-ui, Avenir, Helvetica, Arial, sans-serif;
  line-height: 1.5;
  font-weight: 400;

  background-color: #fff;

  font-synthesis: none;
  text-rendering: optimizeLegibility;
  -webkit-font-smoothing: antialiased;
  -moz-osx-font-smoothing: grayscale;
  -webkit-text-size-adjust: 100%;
}

body {
  margin: 0;
  display: flex;
  place-items: center;
  min-width: 320px;
  min-height: 100vh;
}
Done. Back on track now, developer!
Visualizing Data
Finally, we’ve got the the important part of this exercise. Shall we visualize the data in a Candlestick chart?
First thing, we need a component! Let’s build one. On src, create a folder called components:
mkdir src/componentsThen, create a new folder for the component called Candlestick:
mkdir src/components/CandlestickIn the Candlestick folder, create a component file called Candlestick.tsx:
touch src/components/Candlestick/Candlestick.tsx # echo "" > src/components/Candlestick/Candlestick.tsx (Windows)Now, let’s write some JSX code together. Remember that we installed the ApexCharts npm package, right? Time to use it:
import ReactApexChart from "react-apexcharts";

export const Candlestick = () => {
  return (
    <ReactApexChart options={} series={} type="candlestick" height={350} />
  );
};
Simple, no options or any configuration whatsoever. One step a time 👣
Then, our component must receive the financial data as props:
import ReactApexChart from "react-apexcharts";

import { FinancialData } from "../../types";

export const Candlestick = ({
  financialData,
}: {
  financialData: FinancialData[];
}) => {
  return (
    <ReactApexChart options={} series={} type="candlestick" height={350} />
  );
};
Is our data ready to be used by the ReactApexChart component? The answer is no. The good news is that it isn’t too far though!
A simple JavaScript mapping can help:
import { useMemo } from "react";
import ReactApexChart from "react-apexcharts";

import { FinancialData } from "../../types";

export const Candlestick = ({
  financialData,
}: {
  financialData: FinancialData[];
}) => {
  // use memoized value unless financial data changes
  const formattedData = useMemo(
    () =>
      financialData.map((data) => [
        data[0],
        [data[1], data[2], data[3], data[4]],
      ]),
    [financialData]
  );

  return (
    <ReactApexChart options={} series={} type="candlestick" height={350} />
  );
};
I reckon I deserve a little explanation to you, here it goes:
- I’m using
useMemoReact hook to avoid remapping the dataset in case thefinancialDataprop does not change. - I’m using zero-based index to read data as the API response consists of arrays.
Nice, now we must create two objects for the chart: a series and a options object. Let’s do it:
import { useMemo } from "react";
import ReactApexChart from "react-apexcharts";

import { FinancialData } from "../../types";

export const Candlestick = ({
  financialData,
}: {
  financialData: FinancialData[];
}) => {
  // use memoized value unless financial data changes
  const formattedData = useMemo(
    () =>
      financialData.map((data) => [
        data[0],
        [data[1], data[2], data[3], data[4]],
      ]),
    [financialData]
  );

  // build series object with formatted data
  const series = [
    {
      data: formattedData,
    },
  ] as ApexAxisChartSeries;

  return (
    <ReactApexChart
      options={}
      series={series}
      type="candlestick"
      height={350}
    />
  );
};
All good, developer? Next, the chart options:
import { useMemo } from "react";
import ReactApexChart from "react-apexcharts";

import { FinancialData } from "../../types";

export const Candlestick = ({
  financialData,
}: {
  financialData: FinancialData[];
}) => {
  // use memoized value unless financial data changes
  const formattedData = useMemo(
    () =>
      financialData.map((data) => [
        data[0],
        [data[1], data[2], data[3], data[4]],
      ]),
    [financialData]
  );

  // build series object with formatted data
  const series = [
    {
      data: formattedData,
    },
  ] as ApexAxisChartSeries;

  // set candlestick chart options
  const options = {
    chart: {
      type: "candlestick",
      height: 350,
    },
    title: {
      text: "Ethereum / Bitcoin",
      align: "center",
    },
    xaxis: {
      type: "datetime",
    },
    yaxis: {
      tooltip: {
        enabled: true,
      },
    },
  } as ApexCharts.ApexOptions;

  return (
    <ReactApexChart
      options={options}
      series={series}
      type="candlestick"
      height={350}
    />
  );
};
As you have more charts on your application, you can identify patterns and create common functions to build the chart series and options. However, for the purpose of this exercise, it isn’t required.
Shall we test it, developer? The moment we have been waiting for 🧪
On App.tsx, modify as:
import { useEffect, useState } from "react";
import { getFinancialData } from "./api/client";
import { FinancialData } from "./types";

import { Candlestick } from "./components/Candlestick/Candlestick";

import "./App.css";

function App() {
  const [data, setData] = useState<FinancialData[]>();

  useEffect(() => {
    async function runEffect() {
      // fetch data from client
      const data = await getFinancialData();

      // set data to state
      setData(data);
    }

    // run the async function
    runEffect();
  }, []);

  return (
    <div
      style={{
        display: "flex",
        flexDirection: "column",
      }}
    >
      {!data ? <p>Loading...</p> : <Candlestick financialData={data} />}
    </div>
  );
}

export default App;
So, what was the result? Could you see your Candlestick chart?
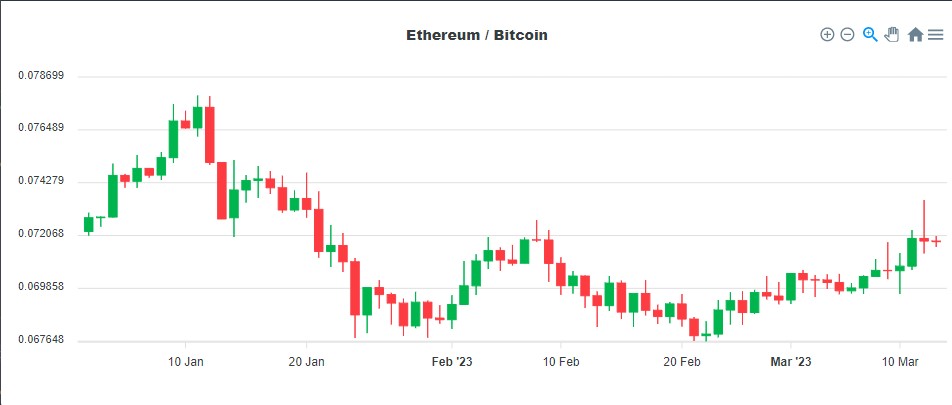
Explore the interactive chart options at the top right side, developer. It’s a pretty nice library 🤗
If not for any reason, please reach out to me so I can help you.
Next Steps
ApexCharts is a library with great variety of modern charts to use when presenting your data. I highly recommend you to spend some time exploring the documentation page.
Useful Resources
Conclusion
Being able to properly present data can be a quite useful knowledge to have, no matter what field you work at.
Regardless if this is your first contact with data visualization or if you have experience with it, I hope to have contributed to your learning somehow.
Hope you had a good time, developer 😄 See you in the next post. Take care.