Welcome to our first post! First of all, I appreciate your interest so far 🖖
I guess nothing more exciting to launch this blog than starting with the D3.js library to create elegant and professional data visualizations. The JavaScript library is widely used in the world and there are plenty of very interesting examples on the web.
The D3.js uses HTML, CSS, and SVG to create its visualization components. It’s a powerful library that enables the developer to go far beyond the common charts when presenting data. For being a Javascript library, the development and management of the visuals are done through the manipulation of the Document Object Model (DOM).
As the first impression, D3.js might look a little overwhelming when we look at the amount of code required to build the visuals and configure its interactions and events. However, it’s always important to remember that it all starts with the first step (I mean…the first line of code).
Our goal here is not only to introduce D3.js to you, or to refresh for those who have read about it before, but also to demonstrate how we can integrate it with React, one of the most popular JavaScript framework out there. As this integration is not out-of-the-box on these libraries, we can find several distinct approaches on how to perform it, such as Lifecycle Methods Wrapping, D3 Within React, React Faux DOM, and others.
For this particular post, we’ll be using the Lifecycle Methods Wrapping. It gives us the ability to explore the most of the visualization library without any limitation or poor performance.
It’s also important to mention, there are quite a few great wrappers which can save you some valuable time depending on your client requirements (or project dealine). Among them, it’s worth to highlight Recharts and Billboard.js. But hold on, this subject definitely deserves its own post (stay tuned 🔥).
Don’t worry if you are not an experienced React developer, only a basic knowledge is necessary to follow the examples 👌 I also encourage you to get creative with some awesome D3.js examples on Observable.
Now enough talking, let’s get our hands dirty!
Table of contents
Open Table of contents
Environment Setup
First step, let’s create a new React application:
npx create-react-app d3-react-welcome-dev
cd d3-react-welcome-dev
npm start
To use npx, make sure you have followed the requirements described in the official documentation .
Feel free to remove any useless object to this example, such as logo.svg, App.css, App.test.js, and index.css (don’t forget to remove its reference as well).
Secondly, we must install the D3.js library in our application:
npm install --save d3Last but not least, let’s add some style to it:
npm install --save styled-componentsThat’s only it! Our environment is now ready to go!
Customizing our App component
Replace your App.js component code with the one below:
import React from "react";
import styled from "styled-components";

const AppContent = styled.div`
  background: #efefe9;
`;

const Header = styled.div`
  background: transparent;
  border-radius: 3px;
  border: 20px solid palevioletred;
  color: black;
  font-weight: bold;
  margin: 0 1em;
  padding: 0.25em 1em;
`;

function App() {
  return (
    <AppContent>
      <Header>Welcome, Developer! Here's a D3.js example!</Header>
    </AppContent>
  );
}

export default App;
Good, at this point we have only added some custom style to our app. Styled-components is a pretty cool library to customize components through CSS-in-JS. If you start your development server, your home page should look like this:
Creating React Wrapper
Now, we’re going to create a React wrapper and get a little closer to building our first D3 component. Here, the wrapper has the purpose of creating an instance of our future D3 visual component and attached it to an HTML object.
As the next step, create a new file called ChartWrapper.js in the same location as your App.js file and copy the following code into it:
import React, { Component } from "react";
import D3BarChart from "../../assets/introduction-to-react-and-d3/D3BarChart";

export default class ChartWrapper extends Component {
  componentDidMount() {
    new D3BarChart(this.refs.chart);
  }

  render() {
    return <div ref="chart"></div>;
  }
}
By instantiating the D3 visual component in the componentDidMount() method, we ensure it only happens when the ChartWrapper has been instantiated and inserted into the DOM.
As you will notice, our code is currently broken as there is no D3BarChart component yet.
Go back to your App.js file and add the import reference to the ChartWrapper we just created:
import ChartWrapper from "../../assets/posts/introduction-to-react-and-d3/ChartWrapper";

...

function App() {
  return (
    <AppContent>
      <Header>Welcome, Developer! Here's a D3.js example!</Header>
      <ChartWrapper />
    </AppContent>
  );
}
Create D3 Visual
Finally, the most exciting part of our introductory application. Let’s create our first D3 component!
To illustrate our example, we’ll read data from the Coinranking API. It’s an online service where we can freely consume cryptocurrency data.
Go to your src folder, create a new file called D3BarChart.js and paste the code below into it:
import * as d3 from "d3";

const url = "https://api.coinranking.com/v1/public/coins";

export default class D3BarChart {
  constructor(element) {
    const svg = d3
      .select(element)
      .append("svg")
      .attr("width", 800)
      .attr("height", 800);

    d3.json(url).then((coinData) => {
      const rects = svg.selectAll("rect").data(coinData.data.coins);

      rects
        .enter()
        .append("rect")
        .attr("x", (d, i) => i * 100)
        .attr("y", 50)
        .attr("width", 50)
        .attr("height", (d) => d.numberOfExchanges)
        .attr("fill", "orange");
    });
  }
}
What we have done above is basically to import a reference of the D3 library to our class, create a SVG object named svg, and send to it the crypto data we read from the API.
Fantastic, we took another step toward our goal.
Now restart your development server, your page should look like this:
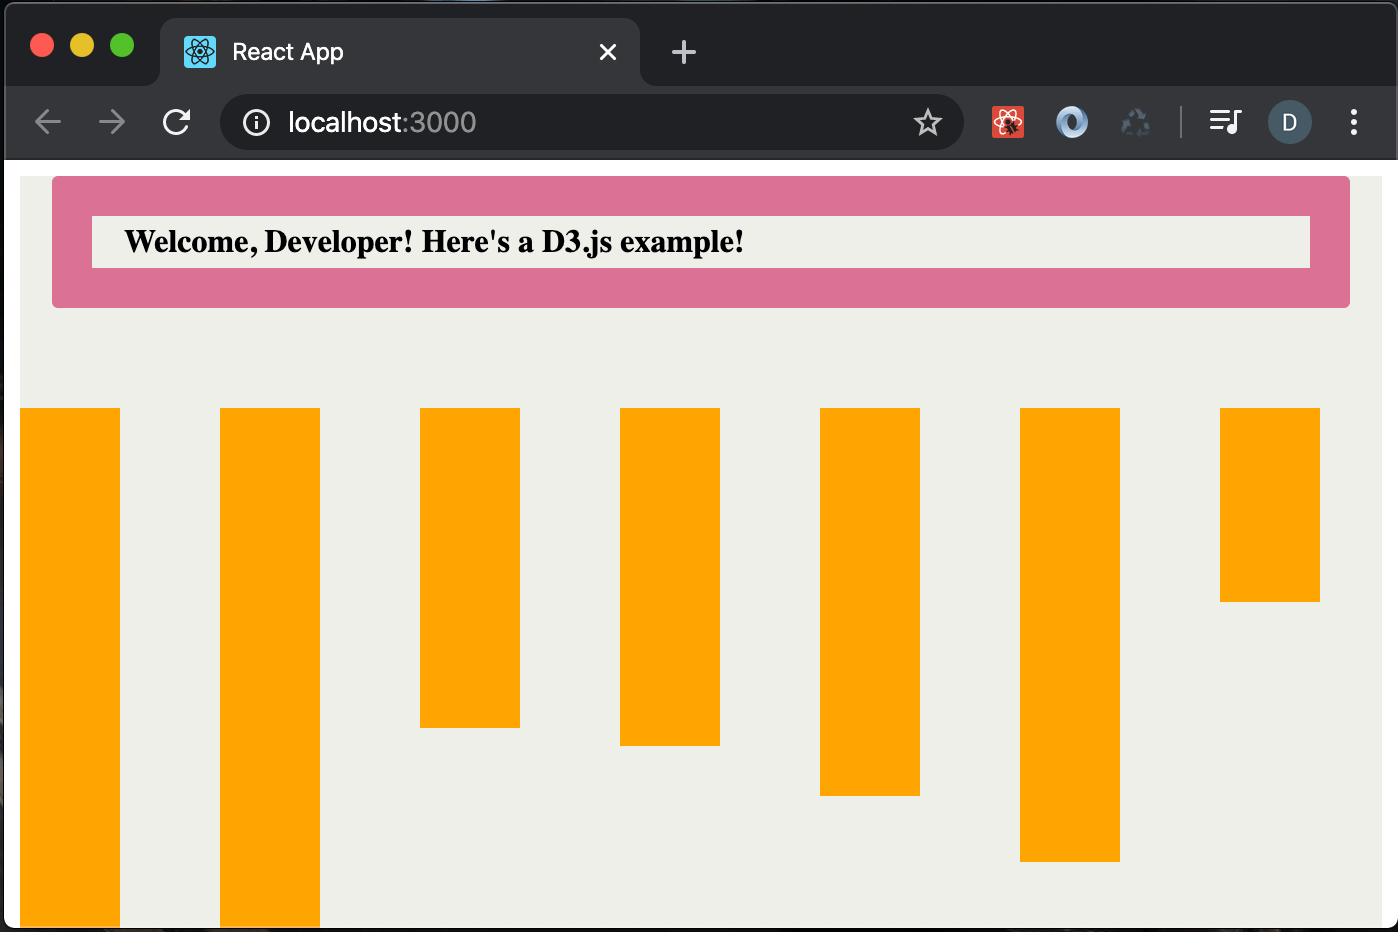
Oh…it isn’t exactly what we were expecting, is it? No panic, nothing that some scaling and a bit of JavaScript code cannot fix 👍
Keep going with me because we’re only a few code blocks away. The result is going to be rewarded, I guarantee you!
Chart Scale
What we need now is to apply linear scale to the y axis, and band scale to the x axis on our D3 component.
Let’s go back then to the D3BarChart.js:
import * as d3 from "d3";

const url = "https://api.coinranking.com/v1/public/coins?limit=10";

const WIDTH = 800;
const HEIGHT = 500;

export default class D3BarChart {
  constructor(element) {
    const svg = d3
      .select(element)
      .append("svg")
      .attr("width", WIDTH)
      .attr("height", HEIGHT);

    d3.json(url).then((coinData) => {
      const ds = coinData.data.coins;

      const y = d3.scaleLinear().domain([0, 300]).range([0, HEIGHT]);

      const x = d3
        .scaleBand()
        .domain(ds.map((d) => d.name))
        .range([0, WIDTH])
        .padding(0.5);

      const rects = svg.selectAll("rect").data(ds);

      rects
        .enter()
        .append("rect")
        .attr("x", (d) => x(d.name))
        .attr("y", (d) => HEIGHT - y(d.numberOfExchanges))
        .attr("width", x.bandwidth)
        .attr("height", (d) => y(d.numberOfExchanges))
        .attr("fill", "orange");
    });
  }
}
The code highlighted above shows what we’ve changed on the component when applying chart scale. Basically, we created a linear scale for the y axis and a band scale for the x axis. Note the rows 35 and 38 how we translate the x and y values into its respective scale value.
At this stage, your bar chart is probably looking a little better but we still need to put some axis information to it.
But first, we must set the y axis with a dynamic domain instead of a hard-coded value. We can do it using the functions max and min:
...
      const y = d3
        .scaleLinear()
        .domain([d3.min(ds, d => d.numberOfExchanges), d3.max(ds, d => d.numberOfExchanges)])
        .range([0, HEIGHT]);
...
Brilliant, now our next move is to set up the chart axis. D3.js has some cool functions we can use to easily auto-generate it for us.
import * as d3 from "d3";

const url = "https://api.coinranking.com/v1/public/coins?limit=10";

const MARGIN = { TOP: 10, BOTTOM: 50, LEFT: 50, RIGHT: 10 };
const WIDTH = 800 - MARGIN.LEFT - MARGIN.RIGHT;
const HEIGHT = 500 - MARGIN.TOP - MARGIN.BOTTOM;

export default class D3BarChart {
  constructor(element) {
    const svg = d3
      .select(element)
      .append("svg")
      .attr("width", WIDTH + MARGIN.LEFT + MARGIN.RIGHT)
      .attr("height", HEIGHT + MARGIN.TOP + MARGIN.BOTTOM)
      .append("g")
      .attr("transform", `translate(${MARGIN.LEFT}, ${MARGIN.TOP})`);

    d3.json(url).then((coinData) => {
      const ds = coinData.data.coins;

      ds.sort(function (a, b) {
        return b.numberOfExchanges - a.numberOfExchanges;
      });

      const y = d3
        .scaleLinear()
        .domain([
          d3.min(ds, (d) => d.numberOfExchanges),
          d3.max(ds, (d) => d.numberOfExchanges),
        ])
        .range([HEIGHT, 0]);

      const x = d3
        .scaleBand()
        .domain(ds.map((d) => d.name))
        .range([0, WIDTH])
        .padding(0.5);

      const xAxisCall = d3.axisBottom(x);
      svg
        .append("g")
        .attr("transform", `translate(0, ${HEIGHT})`)
        .call(xAxisCall);

      const yAxisCall = d3.axisLeft(y);
      svg.append("g").call(yAxisCall);

      const rects = svg.selectAll("rect").data(ds);

      rects
        .enter()
        .append("rect")
        .attr("x", (d) => x(d.name))
        .attr("y", (d) => y(d.numberOfExchanges))
        .attr("width", x.bandwidth)
        .attr("height", (d) => HEIGHT - y(d.numberOfExchanges))
        .attr("fill", "orange");
    });
  }
}
I know, I know… there are quite a few changes to our component at this point. But mostly, it just a couple of margin tweaks regarding the chart’s screen position (rows 5-7, 14-17). What I really want to highlight are the xAxixCall and yAxisCall objects (rows 38 and 44). By adding it to our SVG component, we are able to add data information to the chart axis.
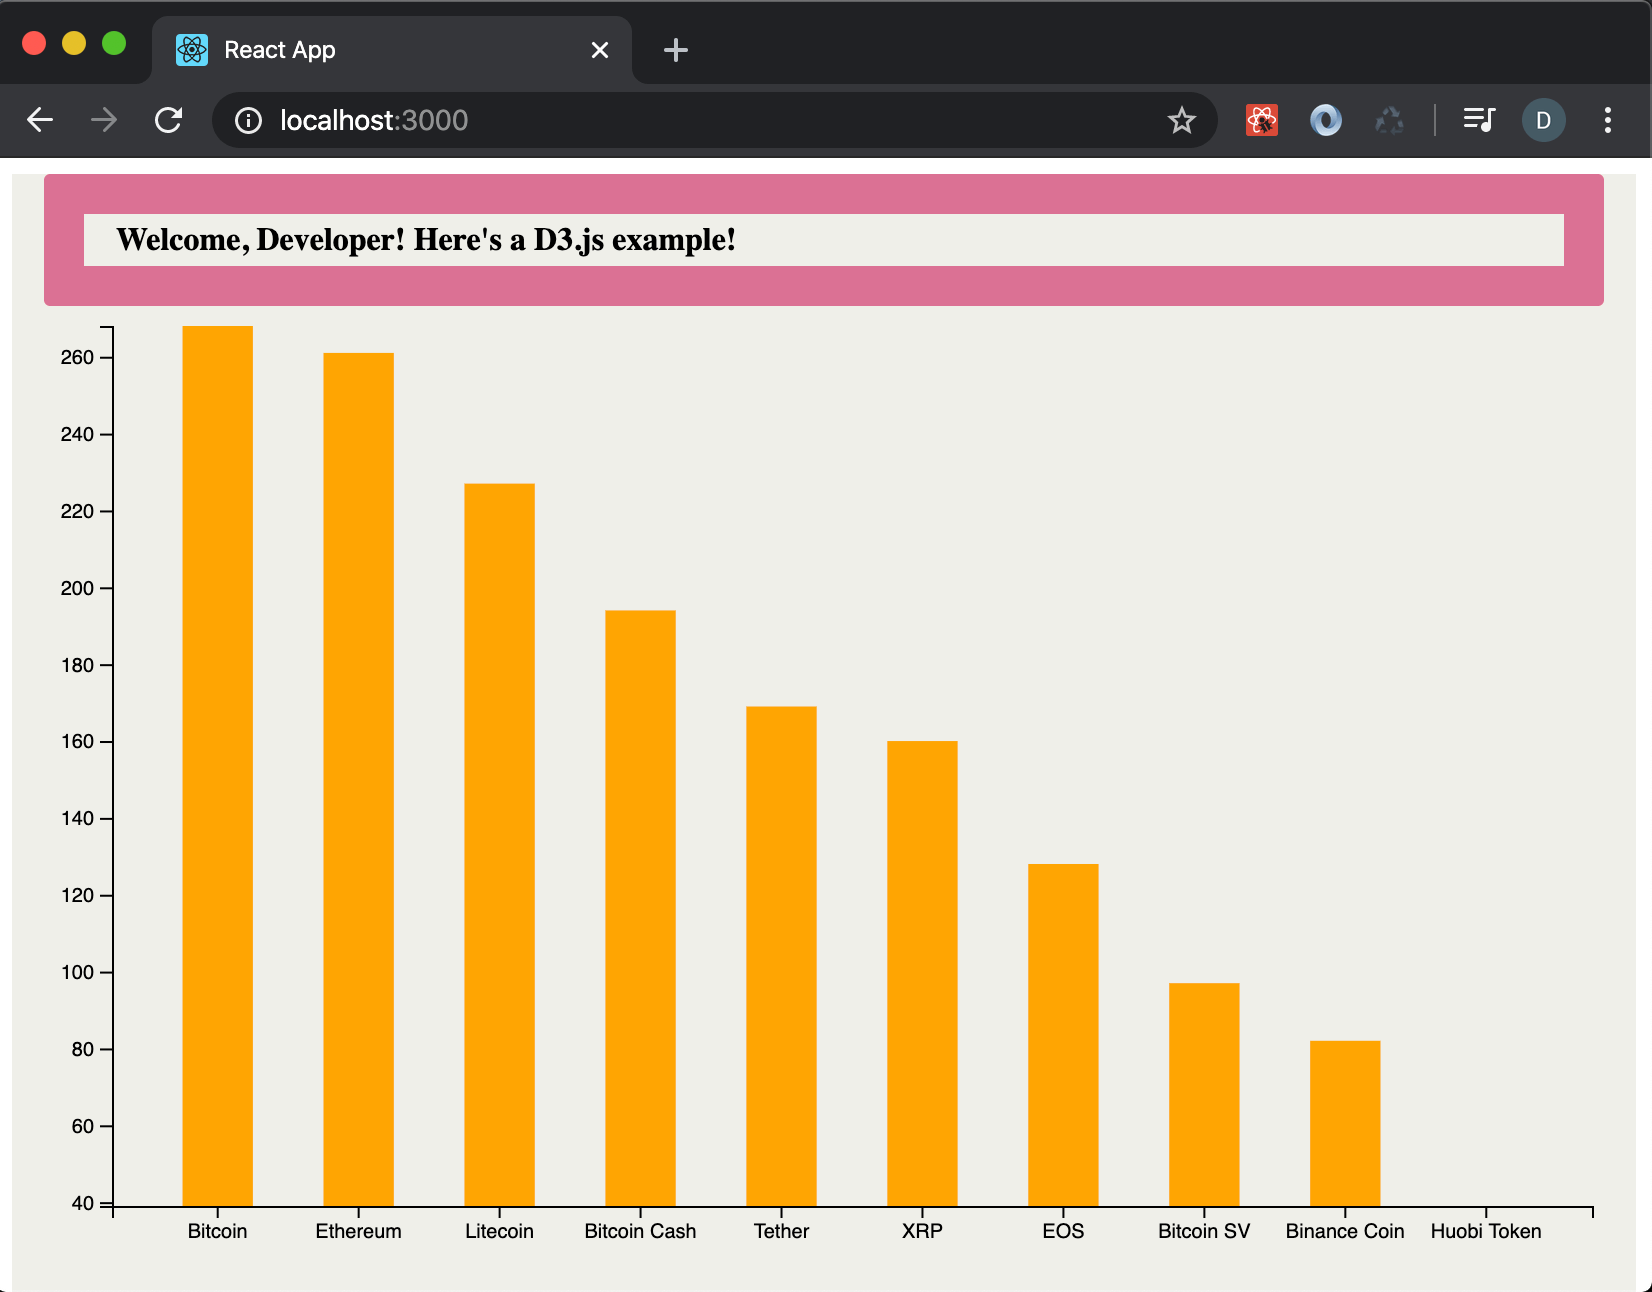
And that’s it. You’ve completed your first React application with D3.js visuals.
That’s really something. Well done 💪
D3.js offers a world of possibilities to customize your visuals and make it awesome. Don’t be afraid, go forward and explore!
Feel free to download the code of this post from the GitHub repository.
Useful Resources
- Today’s Code on GitHub
- D3.js official page
- Observable
- React official page
Conclusion
Thank you very much for everyone who’s got to the end of our first post. It means a lot ♡
Stay tuned, a new post comes every week. Hope you enjoy the subjects we cover, the quality of our posts, and most important, I hope it can aggregate value to you.
You’re welcome to follow me on LinkedIn where I’ll be informing you of new posts.
Keep up with the hard-working, developer. It always pays off. See you in the next post!
Follow Us
The Welcome, Developer has a brand new LinkedIn page! If you enjoy our content, we would be very happy to have you as a follower! In there, we will update you about new posts, new projects, and all the cool stuff!